 Straddle/Strangle Example
Many of you know, I’ve been trading for over 50 years. Over that time, I’ve come to recognize market conditions that coincide with trading opportunities. Here are some of the conditions that led me to one of my latest trades… and an example trade you might love!
The last two weeks of October is when most companies announce third quarter earnings. This particular October, following several years of bullish market conditions, stocks appear to be topping and consolidating. This topping process seems to be accompanied with increased volatility.
In this mix of market environments, stocks with earnings disappointments are getting hit particularly hard while other stocks having positive surprises and large upward moves. This seemed to be an opportunity to speculate with an option strategy that might take advantage of these wide swings in stock price due to surprise earnings announcements.
 The long strangle is an option strategy that can take advantage of a wide swing in stock price in either direction. I used a strangle rather than a straddle because the premiums are generally cheaper and the position is more leveraged. As you may recall a long strangle consists of the purchase of an out of the money (OTM) call and put. The further OTM the call and put are, the lower the combined premium to buy into the position, but the more the stock must move to realize a profit. One side or the other will probably go worthless and the other side has to move in stock price enough to pay for both the put and the call for the position to become profitable.
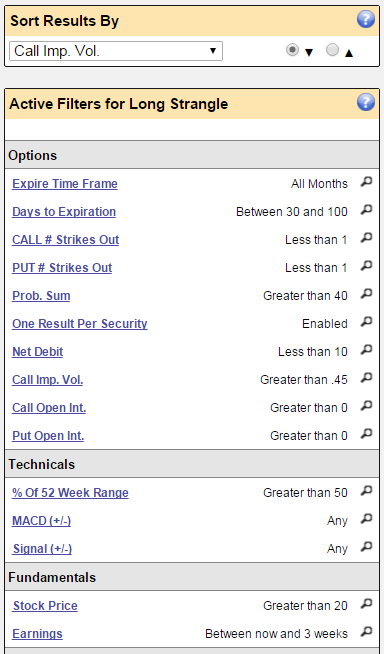
I set up a search on PowerOptions looking for impending earnings opportunities. Here are the search parameters I used:
Option Parameters:
1 strike out of the money (OTM) for both the call and the put. If the expectation is for a negative earnings report and you want to emphasize it you could lower the cost of the call by going more OTM i.e. 2 or 3 strikes. But in this case I had no expectation of a bullish or bearish move one way or the other, but a big move up or down.
Implied Volatility (IV) was set to greater than 0.45 (>45%). Since we needed a big move to pay for the net debit of the option purchase, we need a stock that will make a wide move. The IV was also used to sort the resulting search list from highest to lowest.
The expiration date for the options was set beyond the earnings announcement time frame. I used 30 to 100 days out in time.
Open Interest was set to greater than zero to assure some liquidity. It is good not to be the only trader in the market for your particular options.
Net debit was set to less than 10 points to limit the cost to $1,000 for each position purchased. This would also limit the results to stocks under about $100 per share.
Technical Parameters:
Stock price % of 52 week range was set to greater than 50 (50%). We wanted stocks closer to their highs rather than the lows because any disappointment would would have the potential for greater price movement.
 Fundamental Parameters:
We looked for stocks that would have an earnings announcement between now and 3 weeks out in time.
Stock price was set to greater than 20. Higher price stocks will generally have a larger price movement potential.
A complete summary of the screening parameters is pictured here.
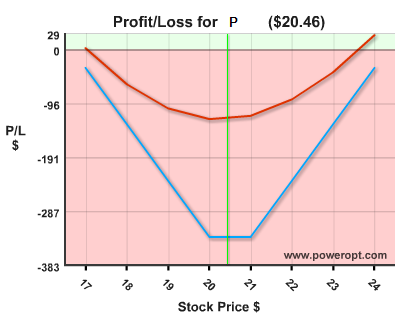
Running this screen on October 12th resulted in a list of 7 opportunities. The first stock in the screened results list that I chose was Pandora Media Inc. (P) at $20.50 per share. Pandora is a music streaming service company that had a recent IPO. The long strangle position was:
P @ $20.50 with third quarter earnings due in 10 days
Buy to open: 20-Nov 21 Call @ $1.64
Buy to open: 20-Nov 20 Put @ $1.69
Net debit: $3.33
Over the subsequent 9 days the stock drifted lower toward $19 per share, but after disappointing earnings were announced (P) declined to $12.98 at the open with a range during the day of $11.50 to $13.38 and closed at $12.39. The put option had a trading price range of $4.55 to $8.10.
 Since the decline was so large I anticipated a rebound later in the day and sold my put option in the morning:
P @ $12.90
Sell to close Put @ $6.76
Return = 103% (6.76-3.33/3.33)
and this was not the best price of the day. The call is presently worthless, but I’m going to hold it just in case there is a rebound in the 26 days remaining before expiration.
As of this writing it is not clear if the call will regain any value by expiration, but it does not cost anything to hold it. For (P), both the earnings and revenue announcements were close to forecast, but the projection for next quarter had concerns about Apple as competition.
This strangle position resulted in a 100% return in 10 days. You can create screens just like this. Log on to your PowerOpt.com subscription or free trial account to make your own search.
P.S.: As mentioned earlier there were seven opportunities the resulted from the screen applied. All of those earnings announcements have now passed (10/28). We historically back tested the outcome for the other resultant stocks. It showed that (P) was the first choice with the best performance. Four of the seven positions were profitable with the average gain for all seven at +35%.